The canvas
Four no-code app builders, four completely different meters

Bubble bills for server work. Glide bills for changed rows. Softr bills for people. Adalo bills for published apps and nothing else. Same category, same promise, four incompatible definitions of an expensive application — and that, not the feature list, is what decides your invoice.
Latest from the desk
All notes →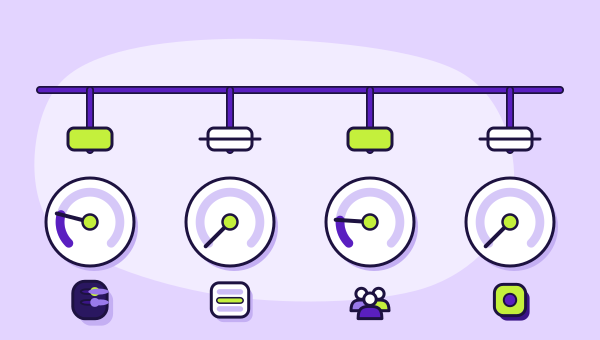
What the Free Tiers Actually Ship on These Four Platforms
All four publish a free plan and none of them tests the thing you need tested. Here is exactly what each one withholds, and how to run a trial that tells you something.
Internal Tools or Client Portals: The Shape Decides the Tool
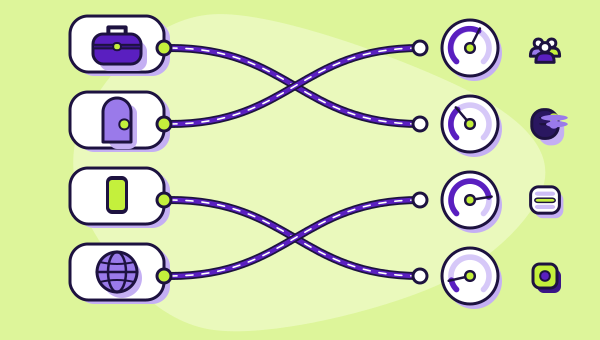
Most people pick a no-code platform on features and then discover it was priced for a different shape of application. Work out which of four shapes you are building first.
Getting Your App Out: What These Platforms Let You Take
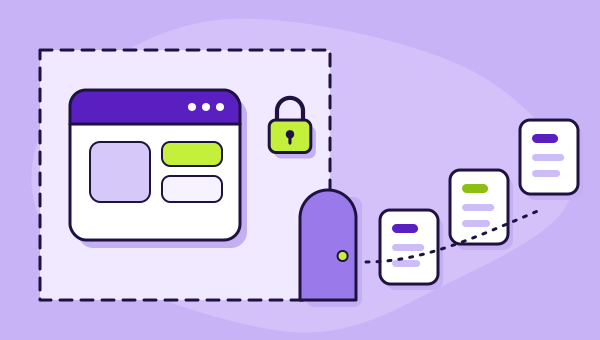
Every one of these vendors documents a way to export your data. Not one documents a way to export the application. That asymmetry is the most important thing to understand before you build.

What an App User Costs on Softr, and Where the Steps Are
Softr is the only platform in this category you can price exactly before you build. The arithmetic is simple; the part that hurts is where the plan boundaries fall.
What Glide Counts as an Update (And What It Doesn't)
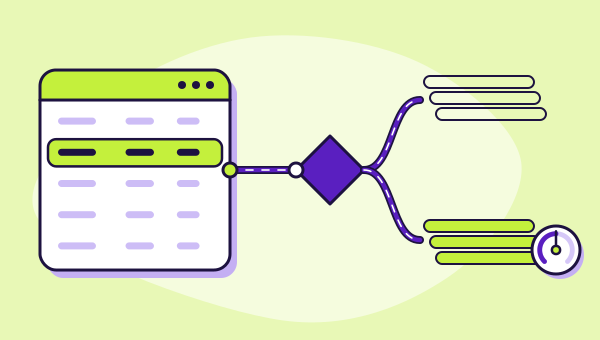
Glide's documentation is unusually specific about which actions cost you an update and which are free. That list contains the single biggest lever you have over a Glide bill.
What a Bubble Workload Unit Is (And Why Nobody Can Price Yours)
Bubble's bill follows server work rather than seats or records. Here is what the unit measures, what the documentation does and does not publish, and how to keep the number down.
Why this desk exists
There is no shortage of no-code app builder comparisons. Nearly all of them rank on capability, which is the easy axis and the one least likely to determine whether you are happy in eighteen months.
The hard axis is the meter. Three of the four platforms covered here bill for something other than seats, and each has chosen a different something. That choice is a theory about what makes an application expensive to run, and if your app does a lot of the thing your platform counts, you will find out slowly and then all at once.
So this site is organised around the meter. Every platform gets read the same way: what it counts, what the vendor publishes about it, where the bill turns, and what happens when you want to leave.
The one number we refuse to publish
Somewhere on every other page about this subject is a sentence beginning "a typical app costs around". That sentence is always fiction.
No vendor publishes a consumption benchmark. Bubble states no per-action workload cost. Glide makes an update conditional on where the data lives. Nobody can tell you what your application will draw because your application does not exist yet, and the people who print a figure anyway have simply chosen a number.
We would rather be less useful and correct. Where a vendor publishes nothing, this site says the cost is unpredictable and explains why — which is genuinely more actionable than a made-up average, because it tells you to go and measure.
What you will find here
Four platform teardowns, the arithmetic underneath each meter, and one ranked comparison that sorts them by which shape of application they suit.
If you have not chosen yet, start with the best no-code app builders and then read the four meters. If you have chosen, go straight to the relevant review. And whichever way you are leaning, read getting your app out before you build anything a business depends on, because none of these platforms documents a way to export a working application and that is a fact worth meeting early.
How the figures are checked
Every price and allowance on this site comes from the vendor's own pricing page or product documentation, with the source recorded and dated. Where a vendor's page could not be read directly, the copy says where the figure came from instead.
Nothing here is measured in a lab, because this desk does not have one. We do not publish load times for generated apps or scores we did not produce. What we publish is what the vendors say, what it means arithmetically, and where the two diverge. The full method is in how we judge.